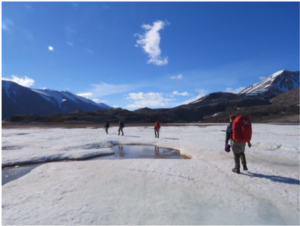
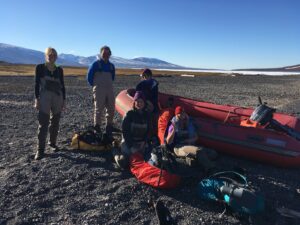
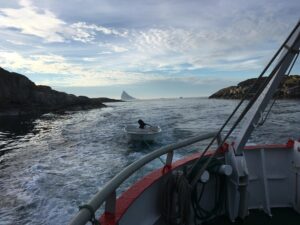
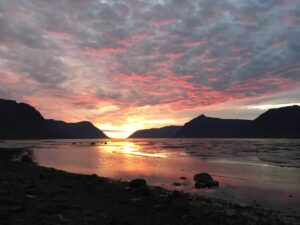
Ring of Fire

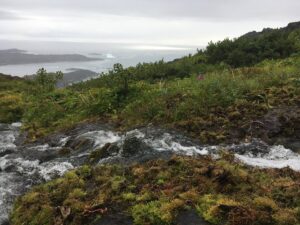
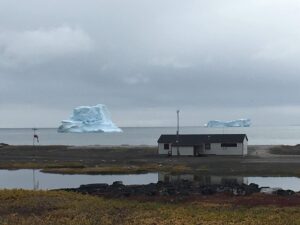
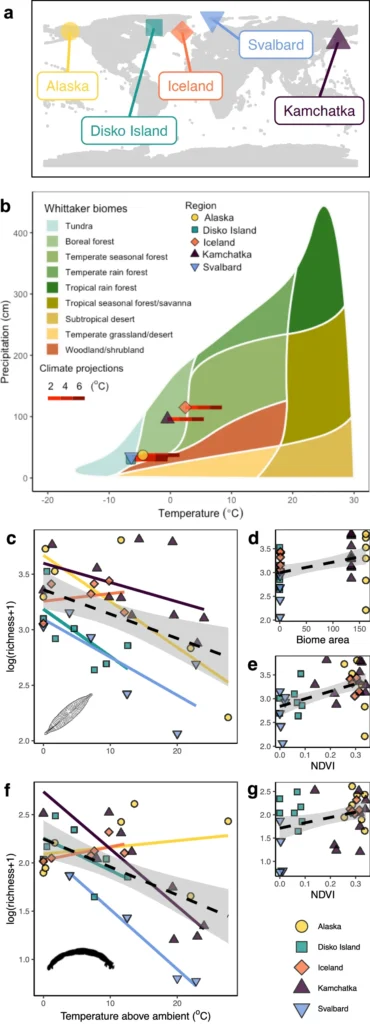
We use geothermal streams as powerful  ‘natural laboratories’ to test the effects of warming on whole natural ecosystems. Sixty streams were sampled over five high-latitude locations where warming is predicted to be especially marked within the next century: Iceland, Greenland, Alaska, Russia, and Svalbard. The streams have a natural temperature range between 2 and 50°C. There is little physical or chemical variation between streams in each location, allowing us to isolate the effects of temperature. We are interested in how warming alters the complex networks of interacting species. 

News and publications

2024 saw the first two publications from the Ring of Fire Project:

  • Regional impacts of warming on biodiversity and biomass in high latitude stream ecosystems across the Northern Hemisphere in Communications Biology. This paper used data collected for a pilot study in 2012 before the full Ring of Fire project sampling in 2016 and 2017. We found a negative overall relationship between diatom and invertebrate species richness and temperature, but the strength of the relationship varied regionally, declining more strongly in regions with low terrestrial productivity (see figure).
  •  Warming reduces trophic diversity in high latitude food webs in Global Change Biology. Here, we used a subset of streams in Hengil, Iceland and Kamchatka, Russia to ask how warming alters food webs. We used stable isotope metrics calculated from invertebrate data and found that higher temperatures simplified trophic diversity and caused a clear shift towards greater assimilation of autochthonous carbon.
 

Photos from the 2016 and 2017 field campaigns: 

Legend: (a) location of the five regions, (b) the biome area each region occupies, including how this could be reshaped with climate projections, and (c-g) general linear model’s. These showed that diatom richness was predicted by a combination of temperature, biome area (in millions of km2), and NDVI. For invertebrates, richness was predicted by temperature, and NDVI. Symbols in cg represent a single stream, coloured lines are the linear model for each region, and the dashed black line represents the overall linear trend with 90% confidence intervals.Photos